

Engineers are always finding creative ways to use mixed domain oscilloscopes. I recently learned about a distinctive and somewhat unusual use for an MDO from David Haworth, one of Tektronix’ own senior applications engineers.
David’s hobby is amateur radio astronomy, and has used an MDO4000 to capture RF emissions from Jupiter and the Sun. Although the designers of the MDO4000 probably never imagined that it would be used for observing solar flares, the instrument is well-suited for this task because it can capture a very wide bandwidth. In the area of the spectrum that David was monitoring, the instrument can capture up to 3.75 GHz at a time.
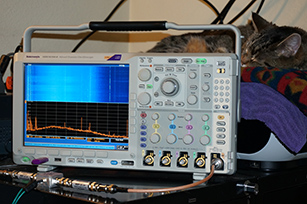
To capture the Sun’s RF emissions, David connected an amateur radio dipole antenna to the spectrum analyzer input through a pre-amp and bandpass filter matched to the response of the antenna. The spectrum analyzer on the instrument runs continuously in spectrogram mode and David uses a program he wrote in Python to save the screen to a 64 GB USB flash drive every 12 seconds. This gives him continuous monitoring capability. He just has to offload the USB memory stick every week or so, and as you can see in the picture below, his cat provides a very low level of supervision.

The MDO4000 screen captures below shows the spectrogram before, during and after a solar flare. On a spectrogram display the brighter areas show frequencies that include more RF energy. In this case the frequency range is set from 17.5 MHz to 24.0 MHz. Time is on the vertical axis, so you can see how the energy levels change as time passes. The vertical lines in the spectrogram show broadcast and amateur radio channels. The vertical bar left of center is radio station WWV, the US national time and frequency standard broadcasting at 20 MHz. These frequency sources are reasonably stable over time. You can also see them on the spectrum shown below the spectrogram that represents the most recent “time-slice” from the spectrogram above.

Tektronix MDO4104-6 spectrum analyzer spectrogram is capturing the start of a solar radio emission. The solar radio emission is the broad bluish white band in the bottom of the top spectrogram window.
Twenty six seconds later the solar flare is seen clearly in the screen shot below, and you can tell that it’s a broadband event. The timestamp in the lower right shows that the event took place 00:34:17 UT (of course he’s got the clock set to universal time) on June 13. David used the screen captures to create a “movie” of the event. Watch it on his website, and keep an eye on the timestamps – you’ll notice that the event lasted more than two minutes. You can see how a solar flare might cause a bit of interference.

The solar flare is seen clearly in the spectrogram, a broadband event that lasted more than two minutes.
David is already looking for ways to improve the system. “The dipole antenna I’m using was easy to get off the shelf, but it has a pretty narrow response. I’ve started looking for a new one that’s designed for a wider response so I can get the most out of the MDO.”
You can learn more about David’s work on capturing RF from space, including some mind-boggling RF signals from Jupiter at: http://www.stargazing.net/david/radio/index.html.
Since publishing the above blog, Tektronix is currently offering a free upgrade to 3/6 GHz spectrum analyzers and a free bundle of software applications on mixed-domain oscilloscopes.